


We make media bias easy to see
Media bias is not easy to identify, as it takes many forms. Some instances of media bias, though, are objectively measurable while others can be exposed by direct comparisons. That's what we do.
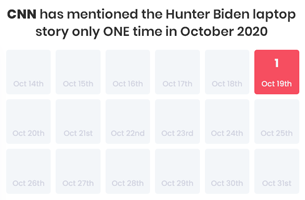
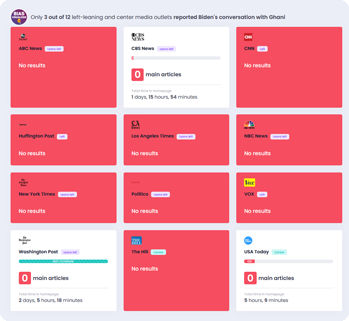
Not reporting facts that tend to disprove claims or beliefs shared by the outlet or journalist, or that can be damaging to a public figure they support.
Where an article is positioned on a homepage determines how many people will read it. So putting a story at the bottom of the homepage with a simple text link can make it go unnoticed by most
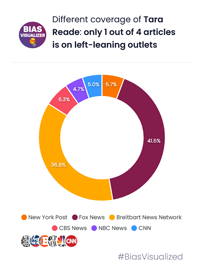
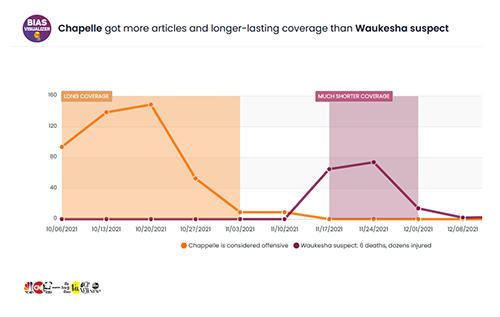
Sometimes very similar scandals or actions get a completely different coverage (both in the number of articles and in the gravity attributed to the issue), only based on the political orientation of the people involved
Reporting an event or instance of something with disproportionately great frequency or emphasis. This can bring the reader to focus only on some issues, neglecting others, and can be used as a scare tactic
Bias Visualizer uses visual reports to expose media bias with a Web app
We get AI-collected and human-verified data updated daily and we analyze it to find the most glaring instances of bias
- The reports we create are simple to read and can be accessed on any device. You can even save the stories you like the most in your personal space
- The process is transparent and straightforward. We even choose subjects to cover together with the Council of our supporters
How we work to keep the media accountable with hard data
First, we get daily AI-collected and human-verified data from all major media outlets' websites. Then we analyze it to find the most glaring instances of bias. Finally, we put them in an easy-to-read visual form, using interactive charts to make it #BiasVisualized
- Cool visual representations We want to make media bias easy to spot and to read so we only use graphics and charts
- Charts, graphics Follow the flow of information, articles and stories and see for yourself how media outlets are covering issues unfairly
- Unique analysis We work hard to analyze issues and stories in ways you will not find on any other Web site or media outlet


